Monday, January 4, 2010
Background of Foreign Exchange
 Foreign exchange, or as it is referred to many times: “forex”, “fx”, or “currency exchange market”, is the term used to describe the trading of world currencies. A currency trade is the simultaneous buying of one currency and selling of another one, e.g. Buying US dollars with euros, buying British pounds with US dollars, selling Swiss francs for Japanese yens etc. The currency combination used in the trade is called a pair. We will dive more into this later on.
The foreign exchange market is by far the largest financial market in the world. Just to put things into perspective, the New York Stock Exchange (NYSE) daily volume fluctuates around US$30 billion per day. Forex market daily volume is estimated to be
around US$1.5 trillion! In fact, daily world stock and bond market volume added up is only a fraction of the daily forex trading volume.
Monday, December 28, 2009
The System of Forex Intraday Pivots Trading - HOW THE TRADE SYSTEM WORKS
When price penetrates a pivot number, it often retraces back to the pivot, and touches it briefly. If it was support that was penetrated, and it does not move back up above it, but continues to hover just below it, there is about to be a drop in price.
At the point that it retraces after dropping below support, enter a sell with a modest stop loss somewhere on the other side of the broken support line. Notice the illustration below of the USD/JPY at 2 am EST. The price had just broken below the S2 number, which was 123.38. It briefly touched the 123.38 to 123.41 area and then began to descend. As you can see, it moved down all through the European and US market sessions.
Monday, December 21, 2009
The System of Forex Intraday Pivots Trading - HOW THE SET-UP SYSTEM WORKS
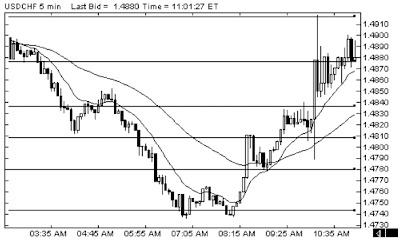
After you have calculated the pivot numbers for the day, place horizontal lines on your 5-minute and 1-hour charts at the pivot numbers for the day, or at least as many lines as your chart gives you room for. It should look something like this:
The lines in the above illustration represent five of the nine calculated numbers. On this five-minute chart, that was all there was room for. The nine numbers are:
R2,M4,R1,M3,Pivot,M2,S2,M1,S1


